

If you want to learn more about the opportunities and challenges of aviation decarbonization, you've come to the right place!
|
This mini-series of small articles will present you successively:
In the previous episode, we looked at operational improvements in the airlines’ hands. We learned that IATA estimated that airlines could reduce their CO2 emissions by up to 14% by implementing fuel-saving best practices. |
ATM inefficiencies
In its latest study published in December 2020, Eurocontrol estimated that the European air traffic management network’s inefficiencies resulted in an average additional fuel burn of 8.6% to 11.2%[1].
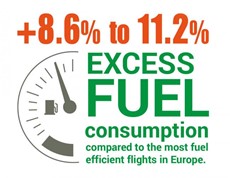
Eamonn Brenna, Director-General Eurocontrol, explains: “This metric for the first time gives us a real picture of the levels of fuel inefficiency in the European air traffic management network. And the fact that it reveals that aircraft are using on average between 8.6% and 11.2% more fuel than the most fuel-efficient flights in the European network should be a wake-up call. However, if the political and operational changes identified in this report are implemented, we could substantially reduce the aviation sector’s CO2 emissions.”
Where do these inefficiencies come from, and how much can be recovered?
This diagram from the World Bank’s comprehensive report on Air Transport and Energy Efficiency[1] shows that inefficiencies come from various interdependencies.
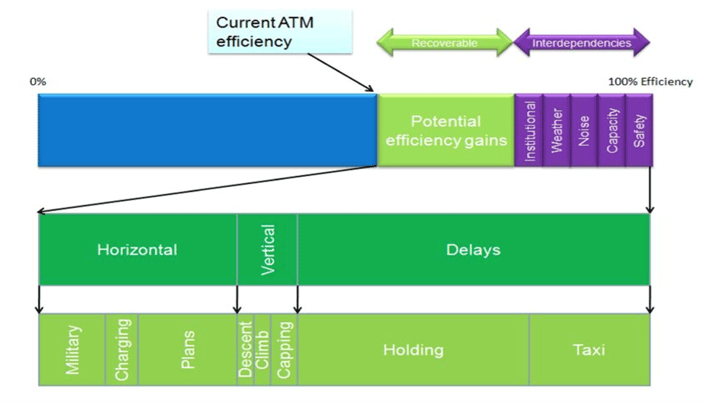
Source: pubdocs.worldbank.org >>
While improved ATM practices can recover some inefficiencies, 100% efficiency cannot be reached because of arbitration in favor of other critical properties: safety, adverse weather avoidance, noise abatement procedures, constraints imposed by military airspaces…
For each flight phase, the Environmental Assessment: European ATM Network Fuel Inefficiency Study[2] looks at performance indicators that account for flight inefficiencies.
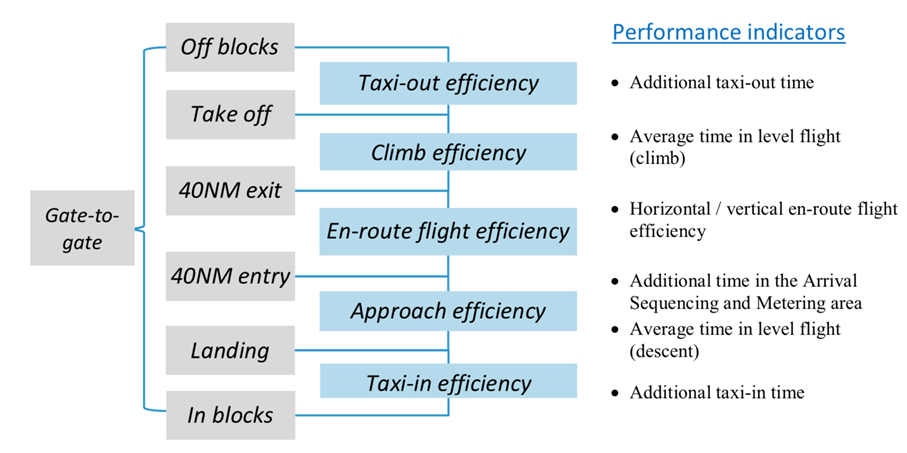
These include additional taxi time, steps during climb or descent, holdings, and horizontal and vertical inefficiencies during the cruise.
The following diagram from the same report indicates how each inefficiency contributes to CO2 emissions.
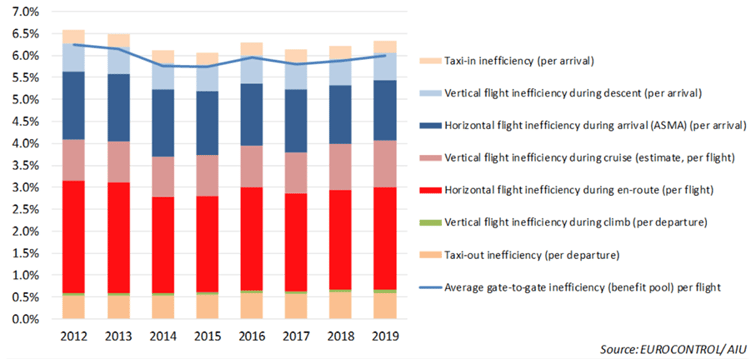
The report indicates that these are just average numbers and that some routes can exhibit inefficiency figures above 25%!
For simplicity, we have focused on the European ATM inefficiencies, but American airspace deals with similar challenges. Both authorities (Eurocontrol and FAA) regularly publish a transparent joint report that compares their efficiency[3].
Concrete examples
The following figure is from a study that OpenAirlines conducted with SkyBreathe for its partner airlines Air France, Corsair, and Transavia. It shows the impact of vertical constraints imposed on western arrival in Paris Orly.
These vertical constraints allow segregating traffic to/from Paris Orly from traffic to/from Paris CDG. While this design’s benefits for safety and traffic flow are uncontested, this study sheds light on their economic and environmental impact.
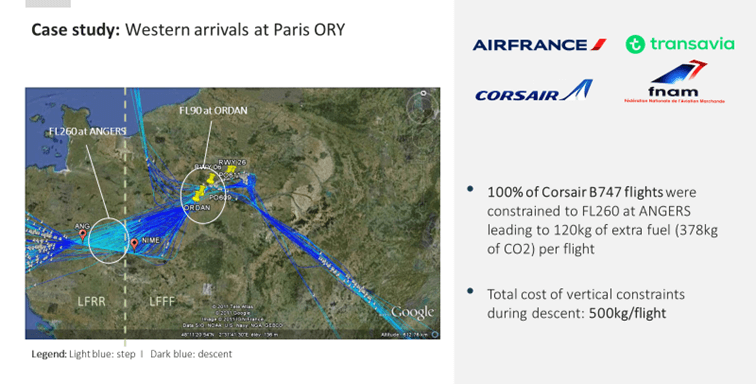
In this figure, blue curves represent actual aircraft trajectories. Dark blue means the aircraft fuel flow is low (aircraft is descending), while light blue means the aircraft fuel flow is high (aircraft is using thrust to maintain a leveled step).
While we see that controllers are granting many directs, we can also witness that all aircraft descend very early at a waypoint called ANG and maintain this low altitude for a long time before resuming their descent. This is not good because an airplane is more efficient when it flies higher.
This procedure, designed mostly to simplify the aircraft’s handover between two controlled zones, is very environmentally unfriendly and is enforced even when there is only one aircraft in the sky.
The next figure comes from a customer of ours that analyzed Dubai’s arrivals using SkyBreathe.
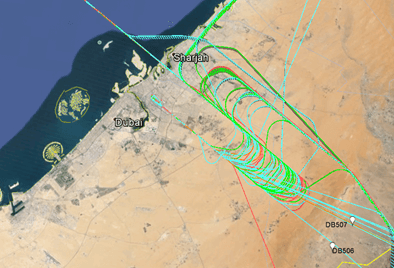
Anticipating a higher traffic flow, Dubai’s approach was redesigned, and the trombone (in black) was extended by pushing further the two waypoints (DB501 and DB507) where the last turn occurs. In practice, almost all flights are allowed to shortcut this final approach, which is good, but the consequence of this new design (which seems overkill) is that all aircraft must now plan, carry and burn extra fuel.
Free Route Airspace
Various ATM iniatives can improve flight efficiency. A concept developed both by the European SESAR project, and North American NextGen initiative concerns free route airspace.
Traditionally, aircraft follow a limited number of pre-defined routes in the sky. These airways are segments between navaids, i.e., beacons or radio transmitters installed on the ground and used by the aircraft to “know its way.”
Later, RNAV (Aera Navigation) was introduced and allowed to define waypoints identified by their LAT/LONG and that do not require beacons on the ground. These led to more flexible and more optimal airways, but airways were maintained, and with them, lateral inefficiency compared to the most direct route.
Free route airspace (FRA) allows an airline to create and follow its own routes within a specified airspace volume. Its flight plan still has to be approved by the ANSP for obvious safety reasons.
This clearly improves flight efficiency, as shown in the following diagram. Airspaces that have implemented free routes (the red dots) show, on average, 0.5% higher efficiency compared to traditional airspaces (in blue).
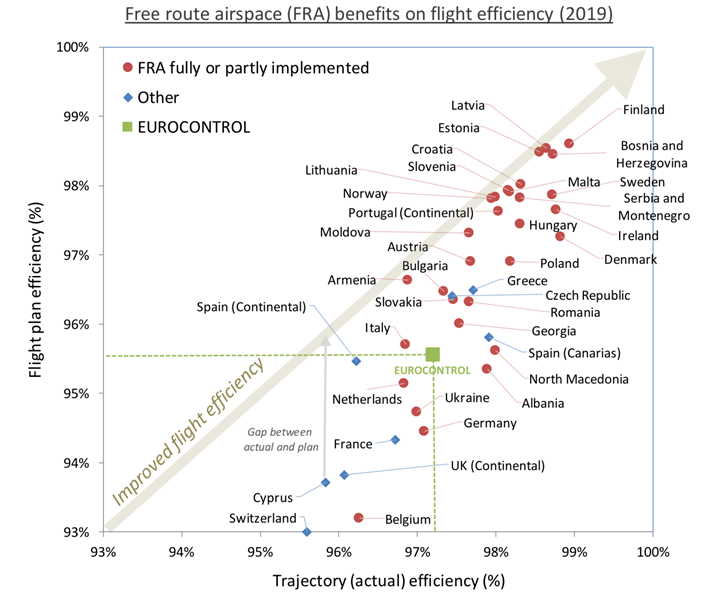
This map shows where FRA was implemented in Europe at the end of 2020. The plan is to have all of Europe covered by the end of 2024.
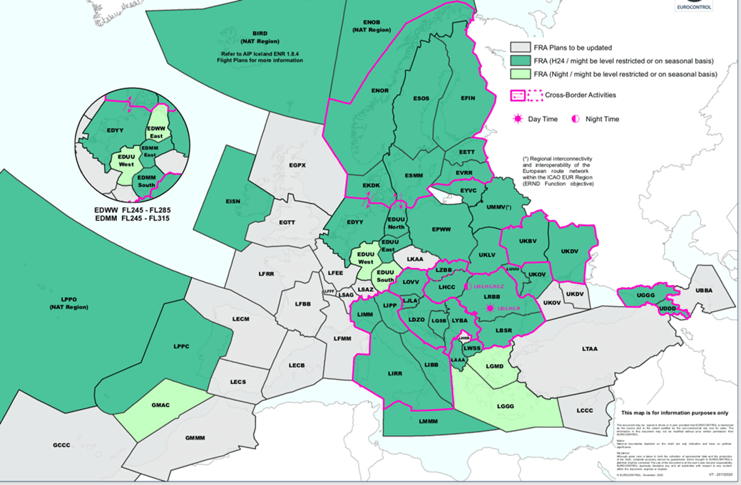
When free route airspace is made available in all of Europe, Eurocontrol estimates it will save 10,000 tons of CO2 per day.
Continuous Climb/Descent Operations (CCO/CDO)
Because it’s easier to ensure safety by imposing aircraft to fly at a set altitude, ATC traditionnaly imposes a step descent to the airport. However, continuous descent is more fuel-efficient (and less noisy) since the aircraft does not need to increase thrust to maintain a step level.
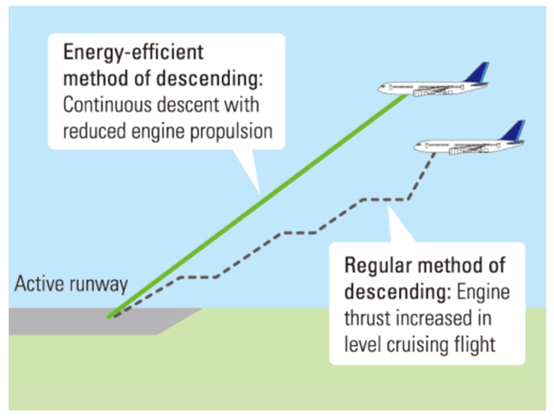
Eurocontrol estimates that the potential saving by generalizing CCO/CDO in Europe amounts to 1.1M tons of CO2 per year.
Unfortunately, current performance, especially at large airports, is far from that, as you can see in the following table:
|
% CDO |
Avg Time in level steps |
Median CDO Altitude |
|
|
2019 |
(Higher = better) |
(Lower = better) |
(Higher = better) |
|
Amsterdam Schiphol |
21% |
178 s |
3,594 ft |
|
Frankfurt Main |
3% |
343 s |
4,834 ft |
|
London Heathrow |
8% |
332 s |
7,820 ft |
|
Madrid Barajas |
20% |
174 s |
6,882 ft |
|
Paris Charles De Gaulle |
3% |
341 s |
4,433 ft |
|
Rome Fiumucino |
33% |
106 s |
9,704 ft |
Performance-Based Navigation
Performance-based navigation and RNP-AR (Required Navigation Performance) are new approaches that optimize aircraft’s guidance at arrival using precise GPS navigation.
With proper approach design, aircraft equipment, pilot training, and certification, this new technology can ensure that an aircraft remains within the designed corridor’s strict boundaries during the final approach.
This is good for safety, especially at airports where approaches are difficult due to the environment (mountains) or weather, but this is also good for the environment by optimizing the approach and fuel consumption.
Alaska Airlines has pioneered this technology with Boeing and the FAA as part of its NextGen project. It estimates that it can save one ton of CO2 per landing at Sea-Tac airport.
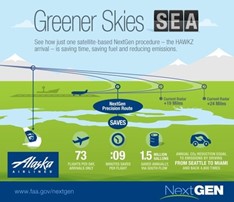
Source: investor.alaskaair.com >>
What’s up in the next episode?
As all good things come to an end, our next episode will be the final one. We’ll wrap it up and conclude that, even though the challenge is daunting, combining all these paths and technological improvement, decarbonizing aviation is a mission possible. The whole industry is focused on this goal.
References
[2 ] https://www.eurocontrol.int/sites/default/files/2020-12/eurocontrol-european-atm-network-fuel-inefficiency-study.pdf
[3] https://www.faa.gov/Air_Traffic/publications/media/us_eu_comparison_2015.pdf
WANT TO LEARN MORE?
[CASE STUDY] See how easyJet uses FDM data to improve fuel efficiency.

