Have you ever wondered how aircraft engines are washed and why it is important to do so? If yes, then this series of articles is made for you. We will address the basics of engine wash, why it is essential to monitor it with adapted tools, and how it impacts the Exhaust Gas Temperature (EGT).
Learn more about engine wash in this three-part series:
- Part 1: Aircraft Engine Wash 101: Why, what, how, when, and how often?
- Part 2: How to optimize your aircraft engine wash schedule using data?
- Part 3: The impact of engine wash on Exhaust Gas Temperature (EGT)
In part 1, we investigated the engine wash process. This second article focuses on the cost versus benefit of such an operation.
MRO (Maintenance, Repair, and Operations) suppliers promise from 1% to 2% of fuel consumption savings following an engine wash, but how can this be monitored? As an airline, how can you determine how often engine washes should be performed? We’ve identified some common steps to guide you through the process and help you evaluate at which frequency you should wash an engine.
Step 1: Access the data of your engine
Thanks to QAR (Quick Access Recorder), it is possible to record and access various parameters linked to the engines while running. Monitoring specific and relevant data is imperative to optimize the engine wash process. In this study, we will focus on the engine fuel flow, while our next article will explore the Exhaust Gas Temperature (EGT).
QAR data are binary and need to be decoded. Once decoded, they must be cleansed, repaired, and completed to be actionable. Fuel efficiency or Aircraft Performance Monitoring (APM) tools such as SkyBreathe® Analytics or SkyBreathe® APM allow performing these steps automatically without any extra workload from your team.
It is also essential to ensure that your engine serial number is correctly tracked due to frequent engine switches between aircraft.
Step 2: Generate a degradation model of your engine
Following an engine wash, retrieve the fuel flow values of your engine type during the cruise phase over the number of cycles.
Some parameters such as the altitude, gross weight, Mach number, or outside air temperature also impact the engine fuel flow during cruise. To ensure these parameters do not affect the analysis, only consider values from step segments (also known as cruise reports) with similar operating conditions. For this operation, take advantage of your Fuel Efficiency or APM software to automatically compute these step segments and filter out those that do not match the defined criteria.
Once these values are available, we consider that the engine fuel flow degradation can be modeled through a linear regression over the number of cycles. The graph below illustrates the different fuel flow measures and the degradation trendline over the number of cycles.
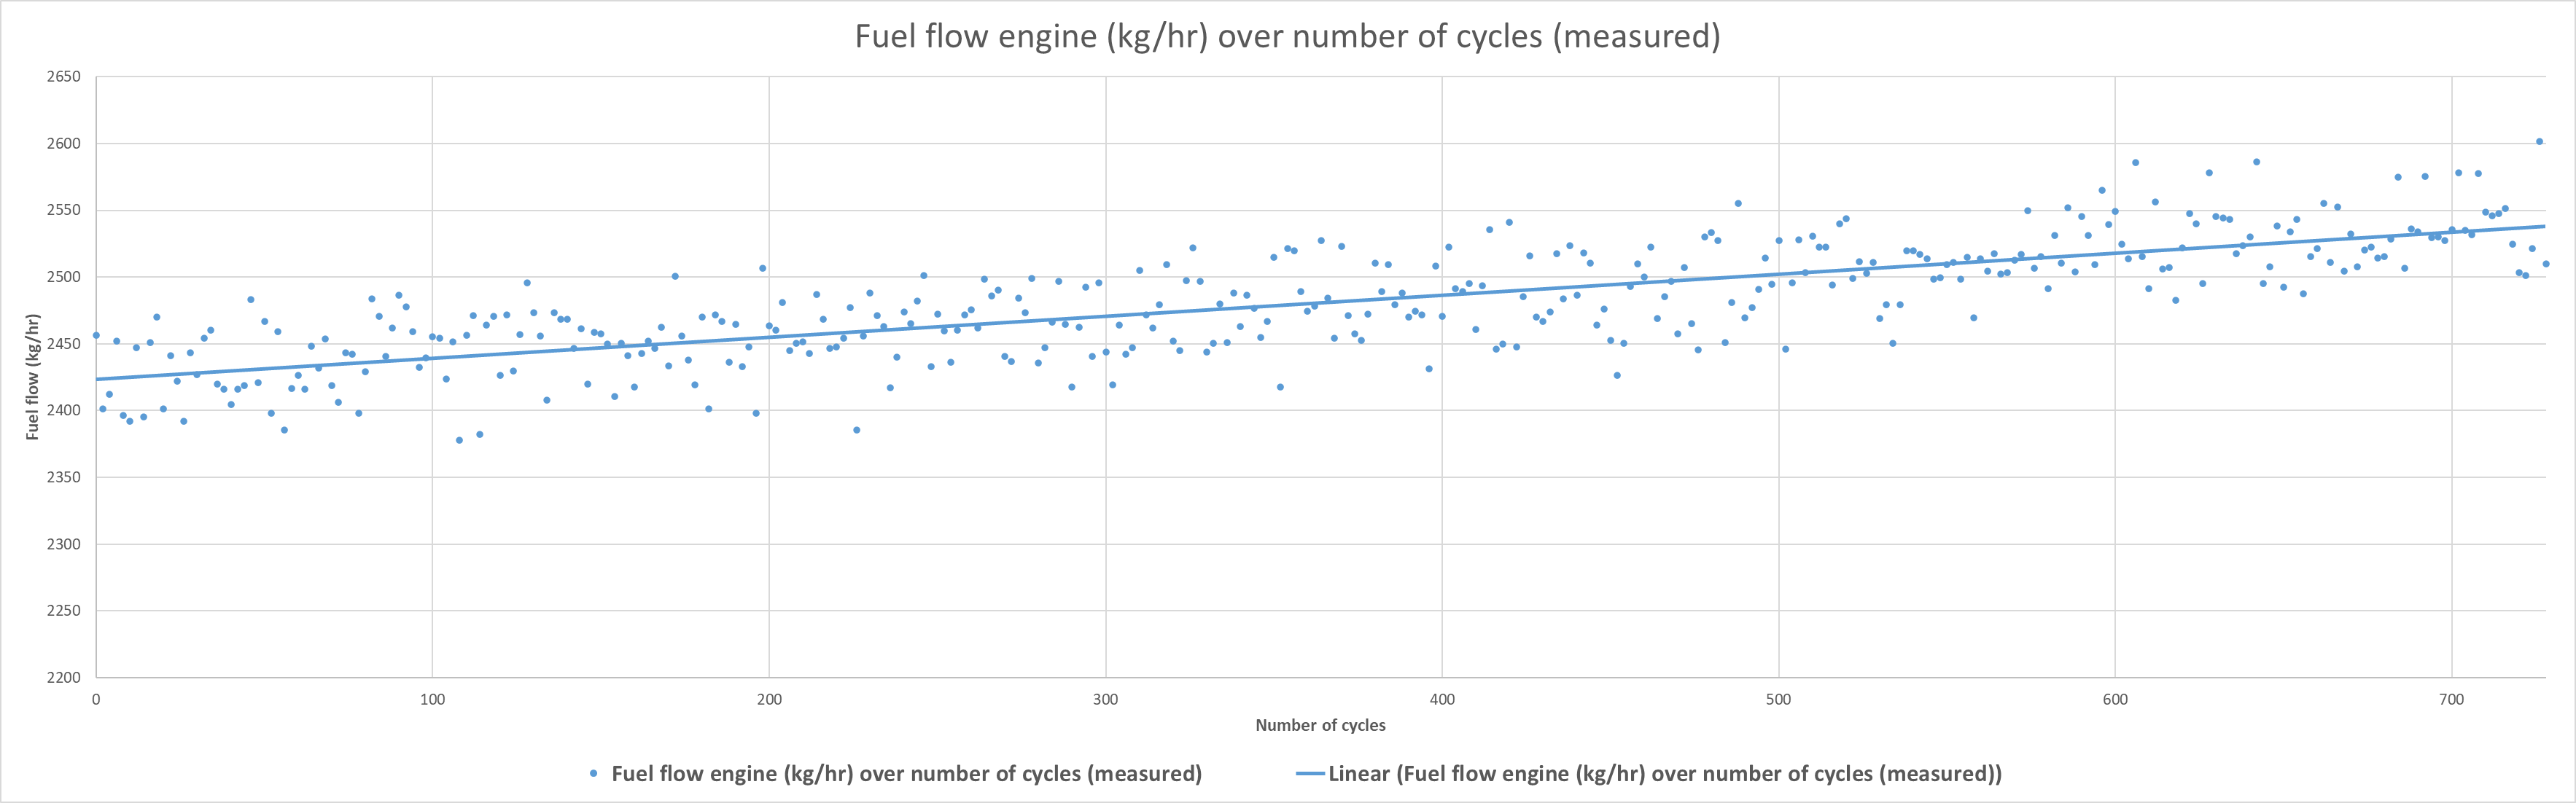
In this example, the engine fuel flow, without any engine wash, degrades on average by 0.15 kg/hr/cycle. It is around 0.013% of degradation at each cycle.
Step 3: Simulate the fuel consumption with engine washes performed at different intervals
Once the degradation model without engine wash is available, we can simulate the engine fuel flow at different washing intervals: after 30, 60, or 120 cycles. These trends are presented by the solid lines on the below graph.
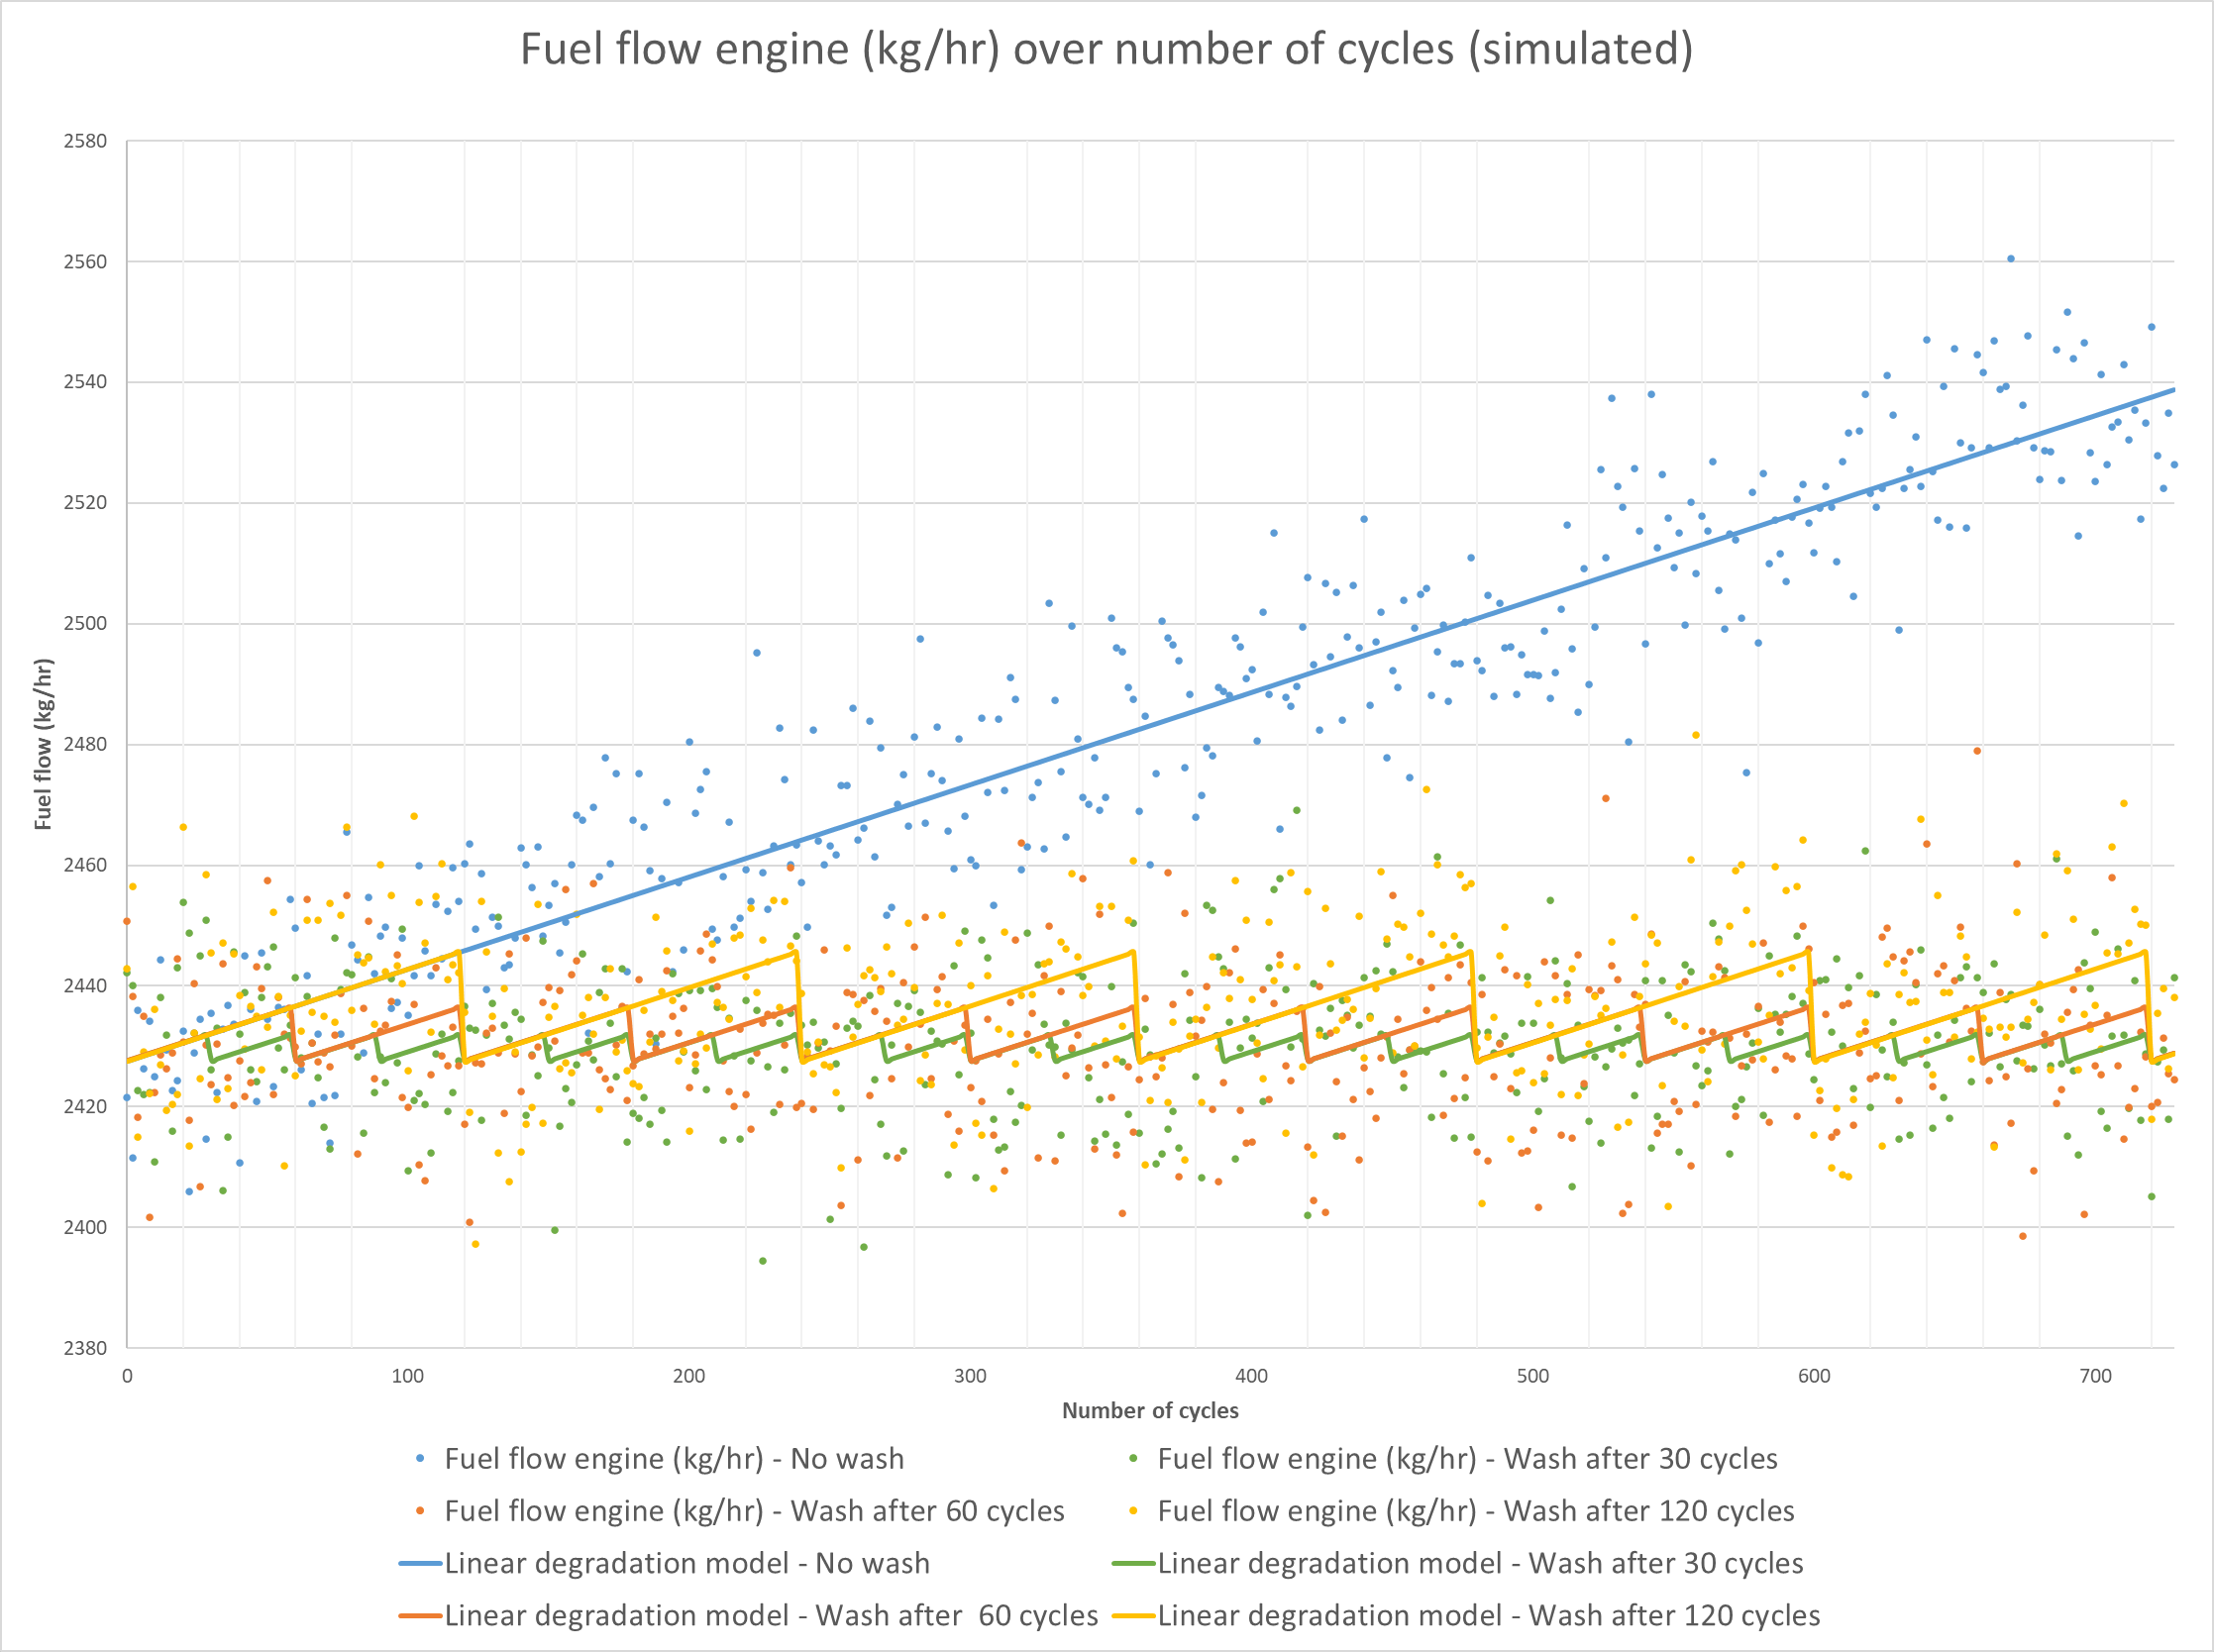
To better represent the operational reality with hazardous fuel flow values, we use a Monte-Carlo modeling to compute the savings calculated in step 4 and add a bit of hazard on top of the degradation model. We consider that the hazard follows a normal distribution with a mean of zero and a standard deviation of 12 kg/hr. The dots then represent the simulated fuel flow over the cycles.
As expected, performing engine washes more frequently tends to maintain the fuel flow at lower values.
Step 4: Compute the savings, the costs, and the optimal interval between two washes
Savings are the difference between a scenario with no wash and one with a wash after several cycles.
For example, let’s compute the savings for an engine that runs on average 9 hours during cruise, each cycle. Other external parameters must be considered in the calculation, such as fuel or engine wash prices. We set external parameters to the following default values:
- Fuel price: 1.2 USD/kg
- Engine wash price: 4,000 USD
- Period: 750 cycles
To compute the savings, we consider that the dots represent the average fuel flow over the average duration of the cruise phase for each cycle. The obtained savings for each scenario are as follows:
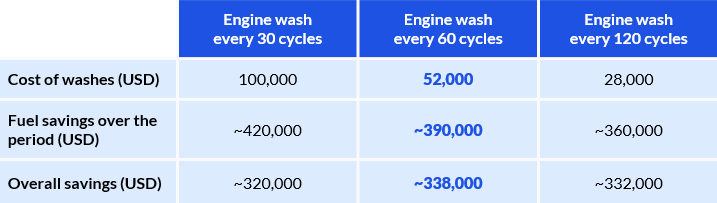
In this example, the best option to maximize savings is to wash the engine every 60 cycles.
Of course, the optimal solution varies depending on inputs and external fluctuations, such as the increase in fuel costs. When fuel prices are high, it is usually better to limit overconsumption by washing engines more often. However, if the costs associated with the engine wash procedure are too high, it could cancel out the savings obtained from reducing fuel burn.
Step 5: Keep on measuring and adjusting your models to predict when to plan the next engine wash
Take the benefits of the data in your QAR to track the effects of the engine wash. Adjust the model if required in case you figure out the aircraft degradation goes faster or slower than planned. Also, consider the age of the engine too. All machines depreciate and deteriorate over time. Even with frequent engine washes, an old engine will not perform as well as a brand-new one.
Step 6: Automate this process and get alerts when it’s time to get your engine washed
Tools such as SkyBreathe® APM automatically analyze the data and send you alerts when it is time to plan your next engine wash. No need to bother with data integration or fiddle with parameters. Let the system be proactive and work for you!
Try SkyBreathe® APM today in our demo environment and start making savings!

With current rocketing fuel prices, monitoring engine wash should be a priority for the aviation industry to reduce fuel consumption and the associated costs. Plenty of best practices allow airlines to save fuel and reduce CO2 emissions. Whether it is eco-piloting techniques, optimized dispatch procedures, or ground operations, airlines should implement fuel efficiency best practices and be equipped with the proper Fuel Efficiency and APM software to track progress.
LEARN MORE
[CASE STUDY] See how Norwegian leverages data analytics to improve its APM process.
>> Download the free case study