Situations where actual flights deviate from the planning are extremely common in airline operations and can cause significant overconsumption compared to the optimal flight plan.
Advanced trajectory analysis can help identify these situations. Even better, it is the only way to reach a deep understanding of these situations and thus define the relevant actions to take. Advanced trajectory analysis is then key to improve flight operations, and this is why we already dedicated an article to the matter, showing that the improvement potential was huge.
To make things even clearer, we propose to go through a real-life example where advanced trajectory analysis helps improving operations and saving fuel and money. Follow us on this case, from the identification of overconsumption, to its fine understanding based on advanced trajectory analysis, to building a set of appropriate actions.
Setting up the case
Our case is a simple, real-life observation based on some of our customers’ data: descents towards the Paris-Orly airport (ORY) overconsume compared to the planning. As shown in the analysis below, this overconsumption represents 100 kg of fuel on average.
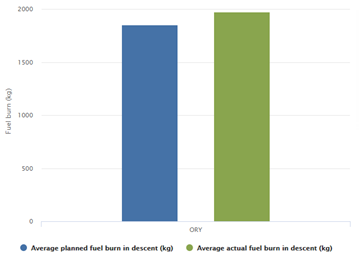
We now want to understand where this overconsumption is coming from and build the appropriate actions to take.
Analyzing and understanding
As our case is already specific to a particular flight phase and destination, it is clear that a very fine level of analysis is needed to go further. That is why we will build a waypoint by waypoint analysis to study our descent case correctly. Let’s see how, step by step.
Visualizing the data to get started
Visualizing the data to see where the analysis should be taken is often a great way to get started.
In our case, we are focusing on arrivals, so looking at end-of-flight characteristics can be insightful. Descents can indeed be different, notably depending on the runway used for landing. When comparing the use of the different landing runways, it is visible that a large part of flights are using runway 26, as illustrated by the analysis below.
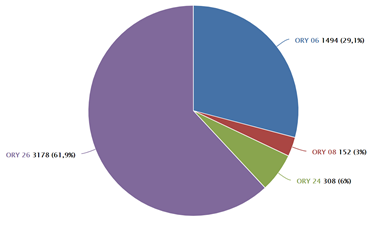
For all the rest of the case, we will focus on operations towards this particular runway to work only on comparable flights while being representative of the whole set of flights.
Analyzing the vertical profile
When it comes to the descent phase, the vertical trajectory is usually very insightful. Therefore we will start our analysis by looking at the flight level by comparing planned and actual values throughout the descent. Results are displayed on the analysis below, where the average planned flight level is in blue, and the average actual flight level is in green, and where waypoints are presented in their natural order.
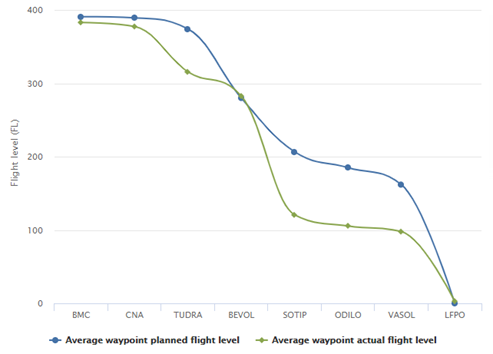
Several observations can be made from these results:
- The descent starts earlier than planned.
- There may be flight level constraints at the BEVOL waypoint. Indeed, we see that the actual flight level evolution is not natural at this waypoint, with a break in the vertical profile shape (actual flight level drops just before and just after this waypoint).
- There may be one or several steps between waypoints SOTIP and VASOL. Indeed, we see that the actual descent is not as continuous as the planned one around these last waypoints.
Another way to look at the same data is to analyze the distribution in the difference between actual and planned flight levels. A good way to do that is to use a boxplot, as presented in the below analysis.
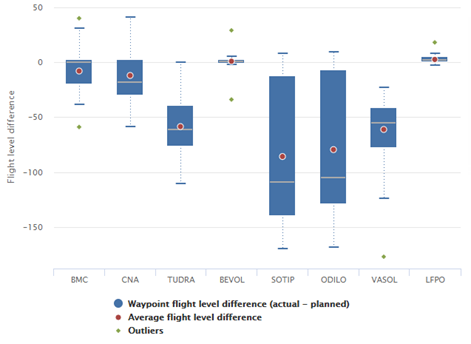
These results confirm that there are flight level constraints at BEVOL waypoint. Indeed, not only are actual flights close to the planned flight level, but there is also virtually no distribution around this flight level.
Analyzing fuel consumption
The above vertical profile analysis provided us with three strong learnings that could impact fuel consumption. Fuel analysis is now needed to confirm the effects, and that is what we will be doing now.
In the below analysis, lines represent the average total fuel consumption since takeoff at each waypoint. Planned values are represented in blue and actual values in green.
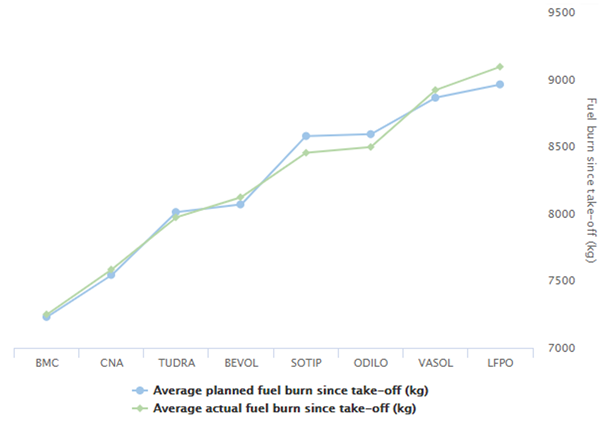
We see that before the start of the descent, at BMC waypoint, actual and planned fuel consumption are the same. At the end of the flight, we see an overburn of around 100 kg. This confirms that the overconsumption discussed in the setup of our case is coming from the descent. But the best learnings are yet to come: we get the following results when we add the fuel consumption between successive waypoints to the analysis.
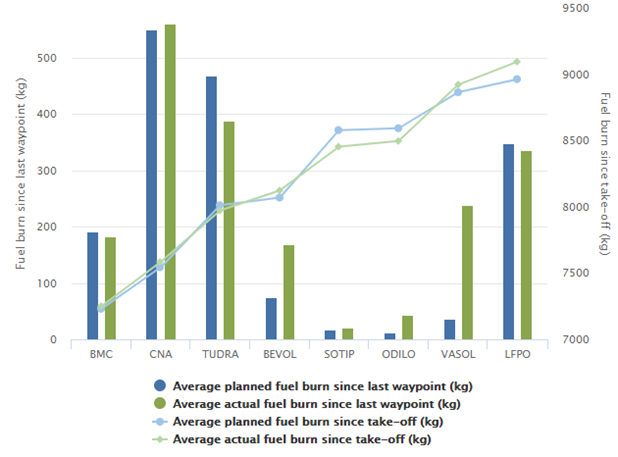
What strikes here are strong overconsumption at ODILP and VASOL waypoints. These overconsumptions correspond to the flight level constraint and the steps at the end of the descent.
We can also comment that the early descent, while being associated with lower fuel consumption at first (at TUDRA waypoint), is harming the overall fuel consumption.
We can now say that the overconsumption observed on the descents towards ORY are due to a strong vertical constraint at BEVOL and to a perturbated vertical profile with an early descent and steps between ODILO and VASOL waypoints.
Taking appropriate actions
Now that the causes of overconsumption from our case are understood, it is possible to define concrete actions to improve flight operations.
The understanding of actual operations can be used to improve flight plans and make them more realistic and accurate. In our case, we saw that flights are constrained around the BEVOL waypoint and experience one or several steps at the end of the descent, so flight plans should reflect this state of fact as much as possible. If refining flight plans is not possible, it could still be a good idea to account for this specificity in another way. For example, defining a company fuel could be interesting. All these measures would contribute to improving flight plan accuracy, thus increasing pilot confidence and ultimately leading to less extra fuel and improved fuel efficiency.
It is also possible to engage with pilots to further assess the vertical constraints experienced. As these constraints depend on ATC, it can then be very interesting to engage with ATC to discuss adjustments. Some of our customers have successfully shared their analysis with ATC authorities to discuss procedure changes or constraints adjustments. Obviously, these discussions are never straightforward, but thorough analysis like the one we conducted is key to building a strong case.
Wrap-up
Advanced trajectory analysis holds huge fuel-saving potential, on top of classical fuel efficiency analysis.
In this article, we went through a real-life case to discuss how such an analysis could be led:
- We first detected overconsumption in descents towards a given destination.
- Using detailed analysis, waypoint by waypoint, we established that it was due to strong vertical profile constraints.
- We identified several concrete actions to take to make operations more fuel-efficient.
Based on this example and with the appropriate tools like SkyBreathe® Advanced Trajectory module, you can now use the same approach to improve the efficiency of your operations even further.
READ MORE
Like what you see? Want to learn more about fuel efficiency?
Discover more case studies and stories from airlines that have been there: